
Module 3 · Lesson 5 of 13 · Reading price · About 6 minutes
Support and Resistance Zones: How Traders Mark Levels
On this page
- What you will learn
- What are support and resistance?
- Why use zones instead of lines?
- Where do traders commonly mark levels?
- What is role reversal?
- Support and resistance diagram
- Do levels weaken with repeated tests?
- How can you draw and rank levels consistently?
- How do levels differ across timeframes?
- What this does not tell you about support and resistance
- Method in Practice
- Check yourself
- Reflect on your own process
- Sources
Before you read: Market Structure Explained: Swings, BOS and CHoCH
What you will learn
- Why support and resistance are better thought of as zones than as exact lines.
- Common places traders mark levels: prior highs and lows, round numbers, and levels that have flipped roles.
- A simple, consistent way to draw and rank levels, and the limits of doing so.
What are support and resistance?
Why would a price where something happened last month matter to anyone today?
Support is a price area where falling prices have previously slowed, paused, or turned up. Resistance is a price area where rising prices have previously slowed, paused, or turned down.
The usual explanation is about memory and orders. Traders remember prices where something happened before. Some may have orders waiting near those prices: buyers who missed the last low, sellers who want to get out near where they bought, or stop orders placed just beyond a well-known high or low. When price returns, those orders can meet it.
That explanation is a model, not a law. A level is a place where something has happened before. Whether anything happens there again is uncertain.
Why use zones instead of lines?
If price turned at 101.95 last time and 102.05 this time, was that the same level?
Price rarely turns at exactly the same tick twice. Different traders mark slightly different highs, use different timeframes, and place orders at slightly different prices. So a level is usefully drawn as a zone: a band a few ticks or points wide.
A simple way to set the width: cover the area where price turned on the previous visits, for example from the highest close to the highest wick at a prior swing high. Wider zones on higher timeframes and narrower ones on lower timeframes are a common habit.
Thinking in zones also changes the language. Instead of “price broke the level by one tick”, you describe “price traded into the zone” or “price closed beyond the zone”.
Where do traders commonly mark levels?
Which prices on a chart could almost everyone see?
Prior highs and lows. The previous session’s high and low, the week’s high and low, and clear swing highs and lows from market structure. These are visible to everyone, which is part of why people watch them.
Round numbers. Prices ending in 00, 50, or other whole figures. Some traders believe orders cluster at round numbers because people tend to choose them. Treat that as a common view rather than a measured fact for any particular market.
Prior value and volume areas. The previous session’s value area high and low, and its point of control (see Auction Market Theory and volume profile).
Gaps. The edges of a gap: the untraded price area left when a session opens above the prior high or below the prior low (see opening types and day types).
Flipped levels. See role reversal, next.
What is role reversal?
Why might a ceiling later behave like a floor, and why might it not?
A role reversal or flip happens when a level that acted as resistance is broken and later acts as support, or the other way round. The common explanation is that participants who sold at the old resistance, or who missed buying the breakout, may act when price comes back to it.
Flips do not always happen. Price often breaks a level and later moves back through it without any pause at all.
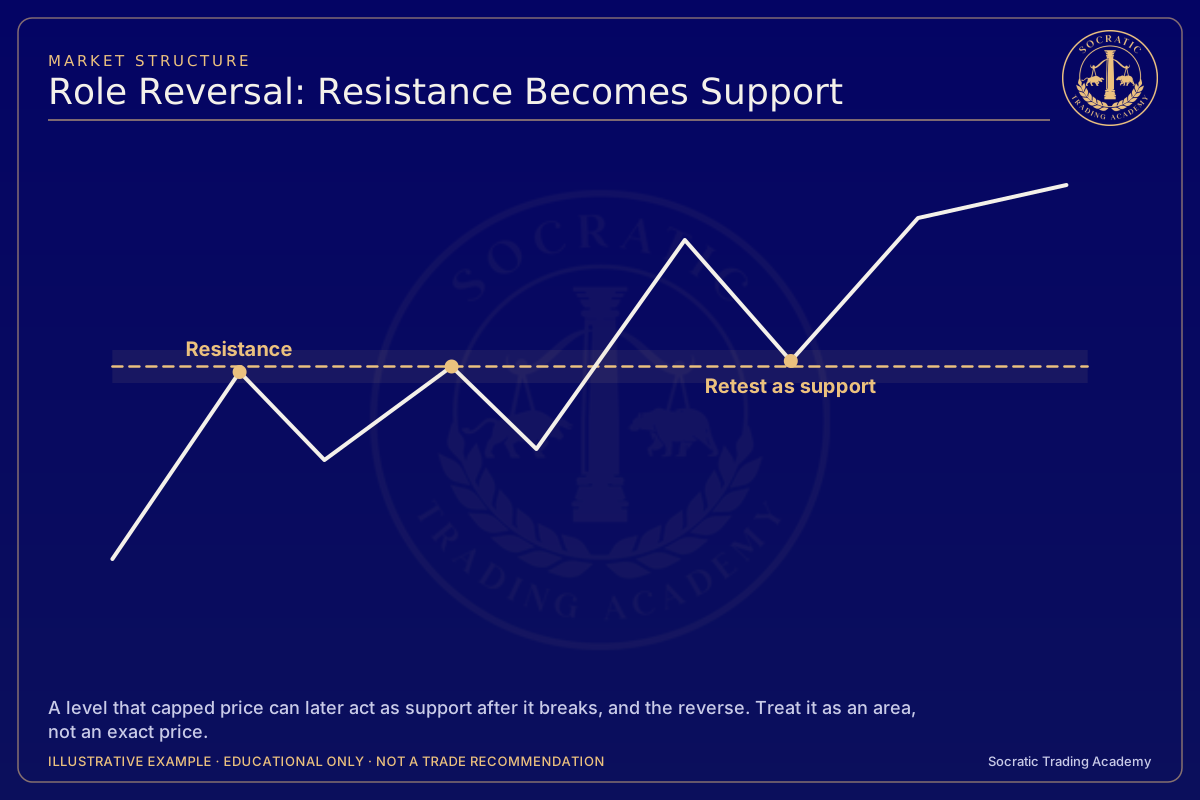
Support and resistance diagram

Illustrative diagram constructed for teaching. Not real market data.
The diagram shows a constructed price path with a resistance zone that is broken and later revisited from above as support, and a support zone tested several times. It is constructed for teaching and is not real data.
Do levels weaken with repeated tests?
If experienced traders believe opposite things, what kind of evidence would settle it?
A test is a return of price to a level. There is a common view among practitioners that each test can weaken a level, because the resting orders that held it the first time get used up. Others argue the opposite, that a level becomes more widely watched the more times it holds.
Both ideas are opinions about behavior. Neither is a rule. A level can hold many times or give way on the second touch. The honest way to study how a level has behaved in a market is to count it on historical data with clear definitions decided in advance, remembering that past behavior does not predict future results. Counts like these describe the past; they are not forecasts. They are not a backtest and do not show what trading the level would have earned.
How can you draw and rank levels consistently?
If you had to explain every level on your chart, how many would survive?
A consistent method matters more than a clever one. Here is one example.
- Start on a higher timeframe (for example, daily). Mark the clearest swing highs and lows of the last few months, plus the prior day’s high and low.
- Draw each as a zone using the wick-to-close method above.
- Merge zones that overlap.
- Rank each zone with simple, written criteria, for example:
- Timeframe may be an explicitly chosen organizational priority, for example putting daily zones first on this worksheet. That is an analyst convention, not evidence that more participants watch them or that they hold more often.
- How recent it is.
- How clearly price turned there (a sharp turn versus a slow drift).
- Whether other references sit in the same zone (a round number, a prior value area boundary).
- Keep only a few. A chart with thirty levels has a level everywhere, which means none of them tells you anything.
- Write down why each level is there. If you cannot say why, remove it.
Ranking is a way to organize a chart, not a measure of how likely a level is to hold.
How do levels differ across timeframes?
Why can one daily level turn into a dozen levels on a one-minute chart?
A daily zone can contain several separately visible intraday turns. Higher aggregation compresses those observations into fewer bars; neither timeframe is the uniquely correct lens. It does not follow that a higher-timeframe level is watched by more participants or has a greater chance of holding. This lesson supplies no defined sample measuring either claim. Record timeframe and zone rule without converting organizational priority into measured strength.
What this does not tell you about support and resistance
- A level does not tell you whether price will turn there or pass through.
- The idea that tests weaken or strengthen a level is a common view, not a rule.
- Round-number effects are a belief held by some traders, not a fixed behavior.
- Ranking levels organizes your chart; it does not measure probabilities.
- Levels look much cleaner in hindsight than they did at the time.
Method in Practice: a zone retest
Fictional example. John, Harbor Index futures, the prices, times, costs and results are all invented for teaching. This shows how a written plan can be built and tested. It is not a recommendation, and nothing here says how often this idea works.
Try it on a real chart. Test this idea yourself on past sessions with bar replay. Keep your own count, including the days with no trade.
The idea. A level doesn't say whether price will turn or pass through (this lesson). John draws old resistance as a zone, not a line. After price breaks above it, his plan waits for a retest of the zone and a close back above it.
John's plan
- Setup
- zone 99.80–100.00 (old resistance). Price broke above it yesterday
- Enter if
- price trades back into the zone, then a 30-minute period closes above 100.00. Buy.
- Wrong if
- a 30-minute period closes below 99.70
- Manage
- take half at 100.60, the rest at 101.10 or by 14:30
- Risk
- $150 maximum, costs included
Three outcomes
-
Worked: the retest held → +$126
-
Failed: retest, close above, then through the zone → −$116, inside the limit
-
No trade: price never came back to the zone → $0
Show the full replays
| Item | Plan |
|---|---|
| Context | Zone 99.80–100.00, broken upward the prior session |
| Entry condition | Price trades at or below 100.00, then a 30-minute period closes above 100.00. Buy 2 at market after that close |
| Wrong if | A 30-minute period closes below 99.70. Exit at market after that close |
| Management | Take profit on half at 100.60 (limit) and move the exit for the rest to the entry price (stop). Rest at 101.10 (limit). Time limit 14:30 CT |
| Risk cap and size | $150. Exiting just under 99.70 is planned to cost about $60 per contract, so 2 contracts |
| Not trading if | Scheduled major release within the hour, or no setup by 12:00 CT |
Replay A: worked
| Time (CT) | What happened | John |
|---|---|---|
| 09:00–09:30 | Low 99.86, inside the zone. Closes 100.12 | Buys 2 at market, filled 100.17 |
| 09:30–11:10 | Trades 100.60 | Sells 1 at 100.60 (limit). Exit for the other moves to 100.17 |
| 11:10–13:40 | Never back to 100.17, trades 101.10 | Sells the last 1 at 101.10 (limit) |
Result after costs: +0.43 point = +$43, +0.93 point = +$93, commissions −$10. Net +$126.
Replay B: failed
| Time (CT) | What happened | John |
|---|---|---|
| 09:30–10:00 | Low 99.84. Closes 100.08 | Buys 2 at market, filled 100.13 |
| 10:00–10:30 | Falls through the zone, closes 99.65 | Wrong-if met: sells 2 at market, filled 99.60 |
Result after costs: 2 × −0.53 point = −$106, commissions −$10. Net −$116.
Replay C: no trade
| Time (CT) | What happened | John |
|---|---|---|
| 08:30–12:00 | Rises from 100.30 to 101.20. Never trades below 100.25 | No retest: no trade |
Result: $0. Journal: "No retest, no trade. The level only mattered in my notes today."
Test it yourself
- Write how wide your zones are and how you draw them, before looking at the outcome.
- Replay every retest of a broken level, and count the ones that failed.
- Count the days price never came back, too.
Where it breaks
- Levels look much cleaner in hindsight.
- "Old resistance becomes support" is a common view, not a rule.
- The zone's width changes which days count as a retest.
Calculators: position sizerisk/rewardexpectancy
Reflection question: Did you draw your levels before or after the move that made them look important?
Check yourself
Reflect on these; there is no score.
- Why might drawing a level as a zone change how you describe a “break”? Hint: trading into versus closing beyond a zone.
- What are two opposite views on what repeated tests do to a level, and how could you check them on a market you follow? Hint: used-up orders versus more widely watched; count it with fixed definitions.
- Why can having too many levels on a chart be worse than having a few? Hint: if a level is everywhere, none stands out.
- A 1-minute chart shows ten small levels inside one daily zone. How would you reconcile them? Hint: different timeframes answer different questions.
- If a worksheet ranks a daily zone ahead of a five-minute zone, has it measured attention or holding probability?
Reflect on your own process
- What written rule sets the width of each zone you mark, and is it the same on every chart?
- For each level on your chart, could you write one sentence in your notes saying why it is there?
- If you counted past tests of a level, which definitions would you write down before looking at the data?
- Did you draw your levels before or after the move that made them look important?