
Module 3 · Lesson 1 of 13 · Reading price · About 5 minutes
Candlestick Anatomy: Open, High, Low, Close and Wicks
On this page
- What you will learn
- Where does a candle come from?
- What are the parts of a candle?
- Candlestick anatomy diagram
- How do you measure a candle?
- What changes with chart settings?
- Why does relative candle size matter?
- What this does not tell you about candlestick anatomy
- Check yourself
- Reflect on your own process
- Sources
Before you read: How Markets Work: Bids, Asks, Spread and Liquidity
What you will learn
- How four prices from a stretch of time become one candle.
- How to measure a candle: its range, its body, its wicks, and where it closed within its range.
- Which parts of a candle are conventions that change with your chart settings.
Where does a candle come from?
If you could keep only four numbers from an hour of trading, which four would you keep?
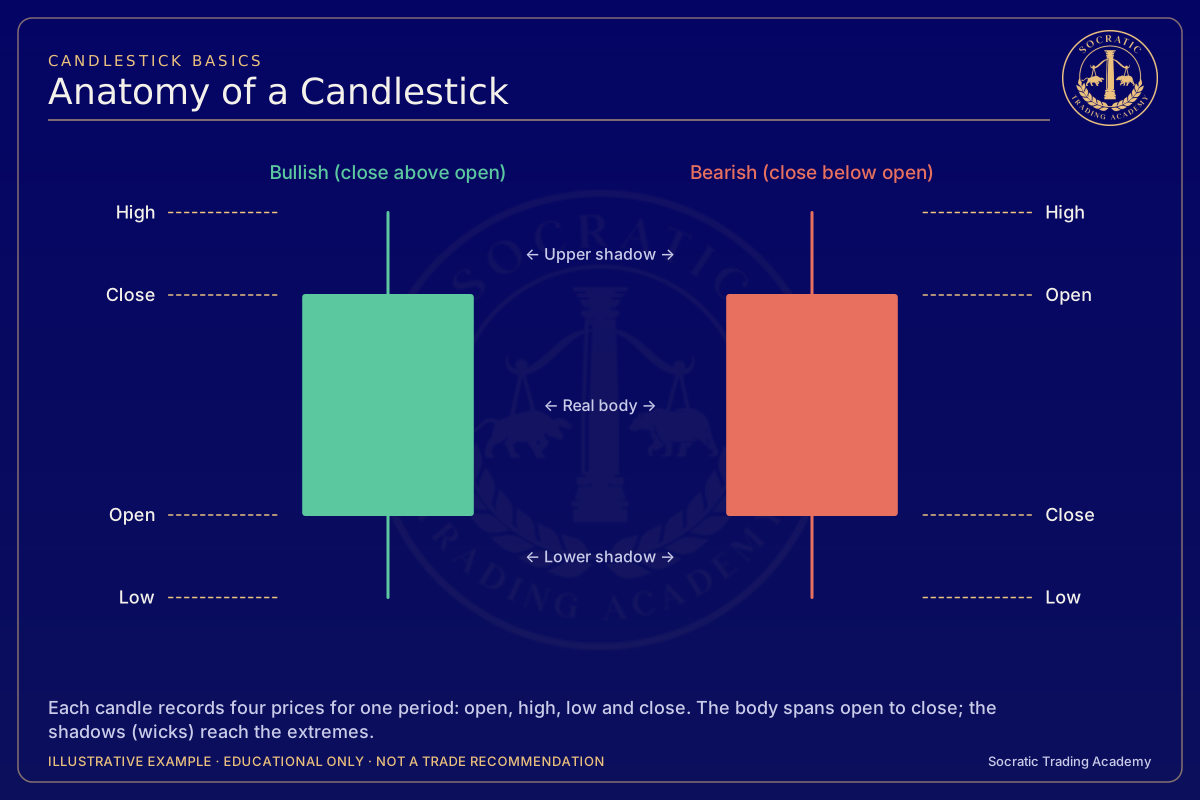
Imagine writing down every trade in a market for one hour. You might end up with thousands of prices. A candle throws almost all of them away and keeps four:
- the open: the first traded price in the period,
- the high: the highest traded price,
- the low: the lowest traded price, and
- the close: the last traded price.
These four are often shortened to OHLC. A candle is a picture of them. A bar chart shows the same four numbers with small ticks instead of a box; the information is identical, only the drawing differs.
Here is a constructed example. In one fictional period the first trade is at 20.40. Price then trades down to 20.10, climbs to 21.00, and the last trade of the period is at 20.80. The candle records open 20.40, high 21.00, low 20.10, close 20.80. What it does not record is the order of events: from the candle alone you cannot tell whether the low came before the high.
What are the parts of a candle?
Which part of the drawing shows the journey from start to finish, and which shows the side trips?
- The body is the box between the open and the close. It shows the net change over the period.
- The upper wick (also called the shadow) is the line from the top of the body up to the high.
- The lower wick is the line from the bottom of the body down to the low.
Color and fill are display conventions, not market measurements. In this lesson’s existing primary artwork, a close-above-open candle is hollow green and a close-below-open candle is filled red; read the labeled open and close as the definition. Other software may use blue/gold or another palette. A color change alone does not change any OHLC number.
If the open and close are equal, or nearly so, there is no visible body, just a thin line crossed by the wicks.
Candlestick anatomy diagram

Colors/fill are conventions; open versus close defines direction.
Illustrative diagram constructed for teaching. Not real market data.
These invented candles close above or below their opens; the colors are a display choice and do not change the open, high, low or close.
Try it on a chart
- Hover over one candle and read its open, high, low and close in the legend at the top left.
- Find a candle whose close is below its open.
Charts and quotes are TradingView's data, not ours, and may be delayed.
How do you measure a candle?
Two candles are the same height. In what ways can they still be different?
Four measurements describe a candle without opinion.
- Range: high minus low. In the example, 21.00 − 20.10 = 0.90.
- Body size: the distance between open and close. In the example, 20.80 − 20.40 = 0.40.
- Body share: body size divided by range. In the example, 0.40 ÷ 0.90 ≈ 44%. Body share compares the net open-to-close displacement with the high–low range; it does not measure all distance traveled inside the bar. A small body share means open and close were relatively close compared with the extrema, not that a known fraction of every price movement was “undone.” OHLC does not record the intrabar path or total traveled distance.
- Close location: where the close sits within the range, from 0% at the low to 100% at the high. In the example, (20.80 − 20.10) ÷ 0.90 ≈ 78%, so the period ended in the upper part of its range.
These numbers are descriptions, not forecasts. They help you compare candles honestly instead of relying on how they look, which can change when a chart is stretched or squeezed.
What changes with chart settings?
If you and a friend look at the same market, why might your candles not match?
Several choices change the candles you see, even for the same market and day.
- Timeframe. A one-hour candle summarizes the same trading that twelve five-minute candles show in pieces. Timeframes and multi-timeframe analysis explores this.
- Session definition. Whether overnight trading is included decides what the daily open and close are (trading sessions and costs).
- Data source. Different feeds can disagree slightly on the high or low, especially for fast spikes.
Separate construction from display. Included session trades, data source and bar aggregation/alignment can change numeric OHLC. The chart’s ordinary display timezone changes clock labels, not the prices or exchange-defined bar boundaries by itself; an explicitly timezone-dependent indicator is a separate calculation. Linear versus logarithmic scale changes spacing, not stored highs/lows. Compare exact symbol, feed, included session and aggregation before comparing price values.
Why does relative candle size matter?
Is a one-point candle big or small?
A candle’s size only means something compared with the candles around it. A range of 0.90 might be large in a quiet market and small in a busy one. Many traders compare a candle with the recent average range, which is the idea behind average true range in technical indicators. Without that comparison, words like “long” or “small” have no fixed meaning.
What this does not tell you about candlestick anatomy
- The order in which prices traded inside the candle.
- How much volume traded, or at which prices.
- Who was buying or selling, or why.
- What the next candle will do. Reading shapes as behavior is the subject of reading candlesticks as behavior, and it has limits of its own.
Method in Practice: a worked example for this topic, with John’s plan and three replays, is in Reading Candlesticks as Behavior: Doji, Hammer, Engulfing.
Check yourself
Reflect on these; there is no score.
- A candle has open 10.00, high 10.60, low 9.80, close 9.90. What are its range, body size and close location? Hint: 0.80, 0.10, and (9.90 − 9.80) ÷ 0.80.
- Why can’t a single candle tell you whether its high or its low came first? Hint: what the four numbers leave out.
- Name two settings that could make your daily candle differ from someone else’s. Hint: sessions and data.
- Why compare a candle with recent candles before calling it large? Hint: size is relative.
- Can a small body share prove that most of the total intrabar travel was reversed? Can changing color or log scale change the candle’s recorded high?
Reflect on your own process
- Which session, feed and timeframe settings does your written chart checklist record before you compare a candle with someone else's?
- When you note a candle in your journal, do you record its measured range and close location or only how it looked?
- How would you check whether two charts you compare use the same session and data source?